日志监控和分析在保障业务稳定运行时,起到了很重要的作用,不过一般情况下日志都分散在各个生产服务器,且开发人员无法登陆生产服务器,这时候就需要一个集中式的日志收集装置,对日志中的关键字进行监控,触发异常时进行报警,并且开发人员能够查看相关日志。logstash+elasticsearch+kibana3就是实现这样功能的一套系统,并且功能更强大。
Logstash:负责日志的收集,处理和储存
Elasticsearch:负责日志检索和分析
Kibana:负责日志的可视化
1、环境介绍
elkServer
IP:192.168.7.27
OS:Centos7.1
FQDN:elk.server.com
elkClient
IP:192.168.31.23
OS:Centos7.1
2、下载准备
官网下载最新的安装包:https://www.elastic.co/downloads(目前有些版本的包可能下载不到了,请到该地址下载——链接:http://pan.baidu.com/s/1gfohO2Z 密码:5s1f)
elasticsearch-1.7.3.noarch.rpm           (server上安装)
kibana-4.1.2-linux-x64.tar.gz            (server上安装)
logstash-1.5.4-1.noarch.rpm              (server上安装)
logstash-forwarder-0.4.0-1.x86_64.rpm    (client上安装)
3、Server端安装
3.1安装jdk1.7

[root@localhost ~]# yum install java-1.7.0-openjdk
Loaded plugins: fastestmirror, langpacks
base                                                                             | 3.6 kB  00:00:00
extras                                                                           | 3.4 kB  00:00:00
updates                                                                          | 3.4 kB  00:00:00
Loading mirror speeds from cached hostfile
 * base: mirrors.btte.net
 * extras: mirrors.163.com
 * updates: mirrors.163.com
Package 1:java-1.7.0-openjdk-1.7.0.91-2.6.2.1.el7_1.x86_64 already installed and latest version
Nothing to do
3.2安装elasticsearch
[root@localhost elk]# yum localinstall elasticsearch-1.7.3.noarch.rpm    (yum 本地安装elasticsearch)
Loaded plugins: fastestmirror, langpacks
Examining elasticsearch-1.7.3.noarch.rpm: elasticsearch-1.7.3-1.noarch
elasticsearch-1.7.3.noarch.rpm: does not update installed package.
Nothing to do
[root@localhost elk]# systemctl daemon-reload
[root@localhost elk]# systemctl enable elasticsearch.service     (设置开机自启动)
ln -s '/usr/lib/systemd/system/elasticsearch.service' '/etc/systemd/system/multi-user.target.wants/elasticsearch.service'
[root@localhost elk]# systemctl start elasticsearch.service    (开启服务)
[root@localhost elk]# systemctl status elasticsearch.service    (查看服务状态)
elasticsearch.service - Elasticsearch
   Loaded: loaded (/usr/lib/systemd/system/elasticsearch.service; enabled)
   Active: active (running) since Sun 2015-11-08 11:05:09 CST; 28s ago
     Docs: http://www.elastic.co
 Main PID: 15345 (java)
   CGroup: /system.slice/elasticsearch.service
           ?..15345 java -Xms256m -Xmx1g -Djava.awt.headless=true -XX:+UseParNewGC -XX:+UseConcMarkSweepGC -XX:CMSInitiatingOccupancyFraction=75 -XX:+UseCMSInitiatingOccupancyOnly -XX:+Heap...

Nov 08 11:05:09 localhost.localdomain systemd[1]: Started Elasticsearch.
[root@localhost elk]# rpm -qc elasticsearch
/etc/elasticsearch/elasticsearch.yml
/etc/elasticsearch/logging.yml
/etc/init.d/elasticsearch
/etc/sysconfig/elasticsearch
/usr/lib/sysctl.d/elasticsearch.conf
/usr/lib/systemd/system/elasticsearch.service
/usr/lib/tmpfiles.d/elasticsearch.conf
[root@localhost elk]# netstat -nltp    (查看端口监听状况)
Active Internet connections (only servers)
Proto Recv-Q Send-Q Local Address           Foreign Address         State       PID/Program name
tcp        0      0 0.0.0.0:111             0.0.0.0:*               LISTEN      784/rpcbind
tcp        0      0 0.0.0.0:22              0.0.0.0:*               LISTEN      1457/sshd
tcp        0      0 127.0.0.1:631           0.0.0.0:*               LISTEN      3213/cupsd
tcp        0      0 127.0.0.1:25            0.0.0.0:*               LISTEN      2656/master
tcp        0      0 127.0.0.1:6010          0.0.0.0:*               LISTEN      14407/sshd: root@pt
tcp6       0      0 :::111                  :::*                    LISTEN      784/rpcbind
tcp6       0      0 :::9200                 :::*                    LISTEN      15345/java
tcp6       0      0 :::9300                 :::*                    LISTEN      15345/java
tcp6       0      0 :::22                   :::*                    LISTEN      1457/sshd
tcp6       0      0 ::1:631                 :::*                    LISTEN      3213/cupsd
tcp6       0      0 ::1:25                  :::*                    LISTEN      2656/master
tcp6       0      0 ::1:6010                :::*                    LISTEN      14407/sshd: root@pt
[root@localhost elk]# firewall-cmd --permanent --add-port={9200/tcp,9300/tcp}    (防火墙添加两个端口)
success
[root@localhost elk]# firewall-cmd --reload    (重载防火墙)
success
[root@localhost elk]# firewall-cmd --list-all    (查看防火墙开发端口)
public (default, active)
  interfaces: ens33
  sources:
  services: dhcpv6-client ssh
  ports: 9200/tcp 9300/tcp
  masquerade: no
  forward-ports:
  icmp-blocks:
  rich rules:
3.3安装kibana
[root@localhost elk]# tar zxf kibana-4.1.2-linux-x64.tar.gz -C /usr/local/    (解压缩安装包到指定目录中)
[root@localhost elk]# cd /usr/local/
[root@localhost local]# ls
bin  etc  games  include  kibana-4.1.2-linux-x64  lib  lib64  libexec  sbin  share  src
[root@localhost local]# mv kibana-4.1.2-linux-x64/ kibana    (重命名)
[root@localhost local]# cd kibana/
[root@localhost kibana]# ls
bin  config  LICENSE.txt  node  plugins  README.txt  src
[root@localhost kibana]# cd bin/
[root@localhost bin]# ls    (运行./kibana即可开启服务,但我们将其做到service)
kibana  kibana.bat
[root@localhost bin]# cd /etc/systemd/system/
[root@localhost system]# vi kibana.service    (编辑kibana服务)

[Service]
ExecStart=/usr/local/kibana/bin/kibana

[Install]
WantedBy=multi-user.target

[root@localhost system]# systemctl enable kibana.service    (设置开机自启动)
ln -s '/etc/systemd/system/kibana.service' '/etc/systemd/system/multi-user.target.wants/kibana.service'
[root@localhost system]# systemctl start kibana.service    (开启服务)
[root@localhost system]# systemctl status kibana.service    (查看服务运行状态)
kibana.service
   Loaded: loaded (/etc/systemd/system/kibana.service; enabled)
   Active: active (running) since Sun 2015-11-08 11:16:28 CST; 10s ago
 Main PID: 16131 (node)
   CGroup: /system.slice/kibana.service
           ?..16131 /usr/local/kibana/bin/../node/bin/node /usr/local/kibana/bin/../src/bin/kibana.js

Nov 08 11:16:28 localhost.localdomain systemd[1]: Started kibana.service.
Nov 08 11:16:34 localhost.localdomain kibana[16131]: {"name":"Kibana","hostname":"localhost.localdomain","pid":16131,"level":30,"msg":"No existing kibana index found","time":"20...43Z","v":0}
Nov 08 11:16:34 localhost.localdomain kibana[16131]: {"name":"Kibana","hostname":"localhost.localdomain","pid":16131,"level":30,"msg":"Listening on 0.0.0.0:5601","time":"2015-11...93Z","v":0}
Hint: Some lines were ellipsized, use -l to show in full.
[root@localhost system]# netstat -nltp    (查看端口监听状态)
Active Internet connections (only servers)
Proto Recv-Q Send-Q Local Address           Foreign Address         State       PID/Program name
tcp        0      0 0.0.0.0:5601            0.0.0.0:*               LISTEN      16131/node
tcp        0      0 0.0.0.0:111             0.0.0.0:*               LISTEN      784/rpcbind
tcp        0      0 0.0.0.0:22              0.0.0.0:*               LISTEN      1457/sshd
tcp        0      0 127.0.0.1:631           0.0.0.0:*               LISTEN      3213/cupsd
tcp        0      0 127.0.0.1:25            0.0.0.0:*               LISTEN      2656/master
tcp        0      0 127.0.0.1:6010          0.0.0.0:*               LISTEN      14407/sshd: root@pt
tcp6       0      0 :::111                  :::*                    LISTEN      784/rpcbind
tcp6       0      0 :::9200                 :::*                    LISTEN      15345/java
tcp6       0      0 :::9300                 :::*                    LISTEN      15345/java
tcp6       0      0 :::22                   :::*                    LISTEN      1457/sshd
tcp6       0      0 ::1:631                 :::*                    LISTEN      3213/cupsd
tcp6       0      0 ::1:25                  :::*                    LISTEN      2656/master
tcp6       0      0 ::1:6010                :::*                    LISTEN      14407/sshd: root@pt
[root@localhost system]# firewall-cmd --permanent --add-port=5601/tcp    (防火墙开启5601端口)
success
[root@localhost system]# firewall-cmd --reload    (重载防火墙)
success
[root@localhost system]# firewall-cmd --list-all    (查看防火墙开放端口)
public (default, active)
  interfaces: ens33
  sources:
  services: dhcpv6-client ssh
  ports: 9200/tcp 9300/tcp 5601/tcp
  masquerade: no
  forward-ports:
  icmp-blocks:
  rich rules:

[root@localhost system]# firewall-cmd --permanent --add-forward-port=port=80:proto=tcp:toport=5601    (为5601端口添加80端口的映射,这样在浏览器中就可以不用输入端口了)
success
[root@localhost system]# firewall-cmd --reload    (重载防火墙)
success
[root@localhost system]# firewall-cmd --list-all    (查看防火墙开放端口)
public (default, active)
  interfaces: ens33
  sources:
  services: dhcpv6-client ssh
  ports: 9200/tcp 9300/tcp 5601/tcp
  masquerade: no
  forward-ports: port=80:proto=tcp:toport=5601:toaddr=
  icmp-blocks:
  rich rules:
3.4安装logstash
[root@localhost system]# cd /home/elk/
[root@localhost elk]# ls
elasticsearch-1.7.3.noarch.rpm  kibana-4.1.2-linux-x64.tar.gz  logstash-1.5.4-1.noarch.rpm  logstash-forwarder-0.4.0-1.x86_64.rpm
[root@localhost elk]# yum localinstall logstash-1.5.4-1.noarch.rpm    (yum本地安装logstash)
Loaded plugins: fastestmirror, langpacks
Examining logstash-1.5.4-1.noarch.rpm: 1:logstash-1.5.4-1.noarch
Marking logstash-1.5.4-1.noarch.rpm to be installed
Resolving Dependencies
--> Running transaction check
---> Package logstash.noarch 1:1.5.4-1 will be installed
--> Finished Dependency Resolution
base/7/x86_64                                                                          | 3.6 kB  00:00:00
extras/7/x86_64                                                                        | 3.4 kB  00:00:00
extras/7/x86_64/primary_db                                                             | 116 kB  00:00:00
updates/7/x86_64                                                                       | 3.4 kB  00:00:00
updates/7/x86_64/primary_db                                                            | 4.7 MB  00:00:03

Dependencies Resolved

===============================================================================================================================================================================================
 Package                                   Arch                                    Version                                     Repository                                                 Size
===============================================================================================================================================================================================
Installing:
 logstash                                  noarch                                  1:1.5.4-1                                   /logstash-1.5.4-1.noarch                                  136 M

Transaction Summary
===============================================================================================================================================================================================
Install  1 Package

Total size: 136 M
Installed size: 136 M
Is this ok [y/d/N]: y
Downloading packages:
Running transaction check
Running transaction test
Transaction test succeeded
Running transaction
  Installing : 1:logstash-1.5.4-1.noarch                                                                                                                                                   1/1
  Verifying  : 1:logstash-1.5.4-1.noarch                                                                                                                                                   1/1

Installed:
  logstash.noarch 1:1.5.4-1

Complete!
[root@localhost tls]# hostname -f    (查看当前FQDN,FQDN设置参见http://www.cnblogs.com/zhenyuyaodidiao/p/4947930.html)
elk.server.com
[root@localhost ~]# cd /etc/pki/tls/    (进入到/etc/pki/tls/文件夹)
[root@localhost tls]# ls
cert.pem  certs  misc  openssl.cnf  private
(以下生成openssl key用于客户端上传日志文件用,在客户端配置时会用到)
[root@localhost tls]# openssl req -subj '/CN=elk.server.com/' -x509 -days 3650 -batch -nodes -newkey rsa:2048 -keyout private/logstash-forwarder.key -out certs/logstash-forwarder.crt
Generating a 2048 bit RSA private key
..............+++
.............+++
writing new private key to 'private/logstash-forwarder.key'
-----
[root@localhost tls]# ls
cert.pem  certs  misc  openssl.cnf  private
[root@localhost tls]# cd private/
[root@localhost private]# ll
total 4
-rw-r--r--. 1 root root 1704 Nov  8 17:20 logstash-forwarder.key
[root@localhost private]# cd ../certs/
[root@localhost certs]# ll
total 16
lrwxrwxrwx. 1 root root   49 Apr 14  2015 ca-bundle.crt -> /etc/pki/ca-trust/extracted/pem/tls-ca-bundle.pem
lrwxrwxrwx. 1 root root   55 Apr 14  2015 ca-bundle.trust.crt -> /etc/pki/ca-trust/extracted/openssl/ca-bundle.trust.crt
-rw-r--r--. 1 root root 1107 Nov  8 17:20 logstash-forwarder.crt
-rwxr-xr-x. 1 root root  610 Mar 24  2015 make-dummy-cert
-rw-r--r--. 1 root root 2388 Mar 24  2015 Makefile
-rwxr-xr-x. 1 root root  829 Mar 24  2015 renew-dummy-cert
[root@localhost ~]# cd /etc/logstash/conf.d/
[root@localhost conf.d]# vi 01-logstash-initial.conf    (编辑logstash配置文件)

input {
  lumberjack {
    port => 5000
    type => "logs"
    ssl_certificate => "/etc/pki/tls/certs/logstash-forwarder.crt"
    ssl_key => "/etc/pki/tls/private/logstash-forwarder.key"
  }
}


filter {
  if [type] == "syslog" {
    grok {
      match => { "message" => "%{SYSLOGTIMESTAMP:syslog_timestamp} %{SYSLOGHOST:syslog_hostname} %{DATA:syslog_program}(?:\[%{POSINT:syslog_pid}\])?: %{GREEDYDATA:syslog_message}" }
      add_field => [ "received_at", "%{@timestamp}" ]
      add_field => [ "received_from", "%{host}" ]
    }
    syslog_pri { }
    date {
      match => [ "syslog_timestamp", "MMM  d HH:mm:ss", "MMM dd HH:mm:ss" ]
    }
  }
}

output {
  elasticsearch { host => localhost }
  stdout { codec => rubydebug }
}


[root@localhost conf.d]# systemctl enable logstash    (设置开机自启动)
logstash.service is not a native service, redirecting to /sbin/chkconfig.
Executing /sbin/chkconfig logstash on
The unit files have no [Install] section. They are not meant to be enabled
using systemctl.
Possible reasons for having this kind of units are:
1) A unit may be statically enabled by being symlinked from another unit's
   .wants/ or .requires/ directory.
2) A unit's purpose may be to act as a helper for some other unit which has
   a requirement dependency on it.
3) A unit may be started when needed via activation (socket, path, timer,
   D-Bus, udev, scripted systemctl call, ...).
[root@localhost conf.d]# systemctl start logstash.service    (开启logstash服务)
[root@localhost conf.d]# systemctl status logstash.service    (查看服务运行状态)
logstash.service - LSB: Starts Logstash as a daemon.
   Loaded: loaded (/etc/rc.d/init.d/logstash)
   Active: active (running) since Sun 2015-11-08 17:28:34 CST; 14s ago
  Process: 20799 ExecStart=/etc/rc.d/init.d/logstash start (code=exited, status=0/SUCCESS)
   CGroup: /system.slice/logstash.service
           ?..20805 java -XX:+UseParNewGC -XX:+UseConcMarkSweepGC -Djava.awt.headless=true -XX:CMSInitiatingOccupancyFraction=75 -XX:+UseCMSInitiatingOccupancyOnly -Djava.io.tmpdir=/var/lib...

Nov 08 17:28:34 elk logstash[20799]: logstash started.
Nov 08 17:28:34 elk systemd[1]: Started LSB: Starts Logstash as a daemon..
[root@localhost conf.d]# netstat -nltp    (查看端口占用)
Active Internet connections (only servers)
Proto Recv-Q Send-Q Local Address           Foreign Address         State       PID/Program name
tcp        0      0 0.0.0.0:5601            0.0.0.0:*               LISTEN      16131/node
tcp        0      0 0.0.0.0:111             0.0.0.0:*               LISTEN      784/rpcbind
tcp        0      0 0.0.0.0:22              0.0.0.0:*               LISTEN      1457/sshd
tcp        0      0 127.0.0.1:631           0.0.0.0:*               LISTEN      3213/cupsd
tcp        0      0 127.0.0.1:25            0.0.0.0:*               LISTEN      2656/master
tcp        0      0 127.0.0.1:6010          0.0.0.0:*               LISTEN      14407/sshd: root@pt
tcp        0      0 127.0.0.1:6012          0.0.0.0:*               LISTEN      17715/sshd: root@pt
tcp6       0      0 :::5000                 :::*                    LISTEN      20805/java
tcp6       0      0 :::111                  :::*                    LISTEN      784/rpcbind
tcp6       0      0 :::9200                 :::*                    LISTEN      15345/java
tcp6       0      0 :::9300                 :::*                    LISTEN      15345/java
tcp6       0      0 :::9301                 :::*                    LISTEN      20805/java
tcp6       0      0 :::22                   :::*                    LISTEN      1457/sshd
tcp6       0      0 ::1:631                 :::*                    LISTEN      3213/cupsd
tcp6       0      0 ::1:25                  :::*                    LISTEN      2656/master
tcp6       0      0 ::1:6010                :::*                    LISTEN      14407/sshd: root@pt
tcp6       0      0 ::1:6012                :::*                    LISTEN      17715/sshd: root@pt
[root@localhost conf.d]# cd /var/log/logstash/
[root@localhost logstash]# ls    (日志文件)
logstash.err  logstash.log  logstash.stdout
[root@localhost logstash]# firewall-cmd --permanent --add-port=5000/tcp    (防火墙开放5000端口)
success
[root@localhost logstash]# firewall-cmd --reload    (重载防火墙)
success
[root@localhost logstash]# firewall-cmd --list-all   (查看端口开放情况)
public (default, active)
  interfaces: ens33
  sources:
  services: dhcpv6-client ssh
  ports: 9200/tcp 9300/tcp 5000/tcp 5601/tcp
  masquerade: no
  forward-ports: port=80:proto=tcp:toport=5601:toaddr=
  icmp-blocks:
  rich rules:
4、Client端安装
[root@localhost elk]# vi /etc/hosts    (编辑hosts文件)


127.0.0.1   localhost localhost.localdomain localhost4 localhost4.localdomain4
::1         localhost localhost.localdomain localhost6 localhost6.localdomain6
192.168.7.27 elk.server.com

[root@localhost elk]# service network restart
Restarting network (via systemctl):                        [  OK  ]
[root@localhost elk]# ping elk.server.com    (测试连接)
PING elk.server.com (192.168.7.27) 56(84) bytes of data.
64 bytes from elk.server.com (192.168.7.27): icmp_seq=1 ttl=63 time=0.754 ms
64 bytes from elk.server.com (192.168.7.27): icmp_seq=2 ttl=63 time=0.477 ms
^C
--- elk.server.com ping statistics ---
2 packets transmitted, 2 received, 0% packet loss, time 1000ms
rtt min/avg/max/mdev = 0.477/0.615/0.754/0.140 ms
[root@localhost laizy]# mkdir elk
[root@localhost laizy]# cd elk/
[root@localhost elk]# ls
[root@localhost elk]# scp root@192.168.7.27:/home/elk/logstash-forwarder-0.4.0-1.x86_64.rpm .     (拷贝logstash-forwarder到本地)
The authenticity of host '192.168.7.27 (192.168.7.27)' can't be established.
ECDSA key fingerprint is 49:b9:53:89:55:f2:93:87:9b:81:bb:23:a5:24:f1:f9.
Are you sure you want to continue connecting (yes/no)? yes
Warning: Permanently added '192.168.7.27' (ECDSA) to the list of known hosts.
root@192.168.7.27's password:
logstash-forwarder-0.4.0-1.x86_64.rpm                                                                                                                        100% 1692KB   1.7MB/s   00:00
[root@localhost elk]# ls
logstash-forwarder-0.4.0-1.x86_64.rpm
[root@localhost elk]# scp root@192.168.7.27:/etc/pki/tls/certs/logstash-forwarder.crt .          (拷贝Server端的key到本地)
root@192.168.7.27's password:
logstash-forwarder.crt                                                                                                                                       100% 1107     1.1KB/s   00:00
[root@localhost elk]# ll
total 1700
-rw-r--r--. 1 root root 1732758 Nov  8 17:36 logstash-forwarder-0.4.0-1.x86_64.rpm
-rw-r--r--. 1 root root    1107 Nov  8 17:37 logstash-forwarder.crt
[root@localhost elk]# cp logstash-forwarder.crt /etc/pki/tls/certs/     (将key拷贝到/etc/pki/tls/certs/下)
[root@localhost elk]# cd /etc/pki/tls/certs/
[root@localhost certs]# ls
ca-bundle.crt  ca-bundle.trust.crt  logstash-forwarder.crt  make-dummy-cert  Makefile  renew-dummy-cert
[root@localhost certs]# cd /home/laizy/elk/
[root@localhost elk]# ls
logstash-forwarder-0.4.0-1.x86_64.rpm  logstash-forwarder.crt
[root@localhost elk]# yum localinstall logstash-forwarder-0.4.0-1.x86_64.rpm     (yum本地安装logstash-forwarder)
Loaded plugins: fastestmirror, langpacks
Examining logstash-forwarder-0.4.0-1.x86_64.rpm: logstash-forwarder-0.4.0-1.x86_64
Marking logstash-forwarder-0.4.0-1.x86_64.rpm to be installed
Resolving Dependencies
--> Running transaction check
---> Package logstash-forwarder.x86_64 0:0.4.0-1 will be installed
--> Finished Dependency Resolution
base/7/x86_64                                                                                      | 3.6 kB  00:00:00
extras/7/x86_64                                                                                    | 3.4 kB  00:00:00
updates/7/x86_64                                                                                   | 3.4 kB  00:00:00

Dependencies Resolved

===============================================================================================================================================================================================
 Package                                        Arch                               Version                                Repository                                                      Size
===============================================================================================================================================================================================
Installing:
 logstash-forwarder                             x86_64                             0.4.0-1                                /logstash-forwarder-0.4.0-1.x86_64                             5.7 M

Transaction Summary
===============================================================================================================================================================================================
Install  1 Package

Total size: 5.7 M
Installed size: 5.7 M
Is this ok [y/d/N]: y
Downloading packages:
Running transaction check
Running transaction test
Transaction test succeeded
Running transaction
  Installing : logstash-forwarder-0.4.0-1.x86_64                                                                                                                                           1/1
Logs for logstash-forwarder will be in /var/log/logstash-forwarder/
  Verifying  : logstash-forwarder-0.4.0-1.x86_64                                                                                                                                           1/1

Installed:
  logstash-forwarder.x86_64 0:0.4.0-1

Complete!
[root@localhost elk]# systemctl enable logstash-forwarder     (设置开机自启动)
logstash-forwarder.service is not a native service, redirecting to /sbin/chkconfig.
Executing /sbin/chkconfig logstash-forwarder on
The unit files have no [Install] section. They are not meant to be enabled
using systemctl.
Possible reasons for having this kind of units are:
1) A unit may be statically enabled by being symlinked from another unit's
   .wants/ or .requires/ directory.
2) A unit's purpose may be to act as a helper for some other unit which has
   a requirement dependency on it.
3) A unit may be started when needed via activation (socket, path, timer,
   D-Bus, udev, scripted systemctl call, ...).
[root@localhost elk]# systemctl start logstash-forwarder.service     (开启服务)
[root@localhost elk]# cd /var/log/logstash-forwarder/    (日志目录)
[root@localhost logstash-forwarder]# ls
logstash-forwarder.err  logstash-forwarder.log
[root@localhost elk]# vi /etc/logstash-forwarder.conf    (编辑配置文件)

{
  "network": {
    "servers": [ "elk.server.com:5000" ],

    "ssl ca": "/etc/pki/tls/certs/logstash-forwarder.crt",

    "timeout": 15
  },

  "files": [
    {
      "paths": [
        "/var/log/messages",
        "/var/log/secure"
      ],

      "fields": { "type": "syslog" }
    }
  ]
}


[root@localhost elk]# systemctl restart logstash-forwarder.service     (重启服务)
[root@localhost elk]# systemctl status logstash-forwarder.service      (查看服务运行状态)
logstash-forwarder.service - LSB: no description given
   Loaded: loaded (/etc/rc.d/init.d/logstash-forwarder)
   Active: active (running) since Sun 2015-11-08 18:30:51 CST; 18s ago
  Process: 10788 ExecStop=/etc/rc.d/init.d/logstash-forwarder stop (code=exited, status=0/SUCCESS)
  Process: 10794 ExecStart=/etc/rc.d/init.d/logstash-forwarder start (code=exited, status=0/SUCCESS)
   CGroup: /system.slice/logstash-forwarder.service
           ?..10798 /opt/logstash-forwarder/bin/logstash-forwarder -config /etc/logstash-forwarder.conf

Nov 08 18:30:51 localhost.localdomain systemd[1]: Starting LSB: no description given...
Nov 08 18:30:51 localhost.localdomain /etc/init.d/logstash-forwarder[10799]: logstash-forwarder started
Nov 08 18:30:51 localhost.localdomain logstash-forwarder[10794]: logstash-forwarder started
Nov 08 18:30:51 localhost.localdomain systemd[1]: Started LSB: no description given.
5、界面验证
首先在client中手动增加一条日志:
[root@localhost elk]# logger zhenyuLogtest
界面登录 http://192.168.7.27/ ,做如下操作
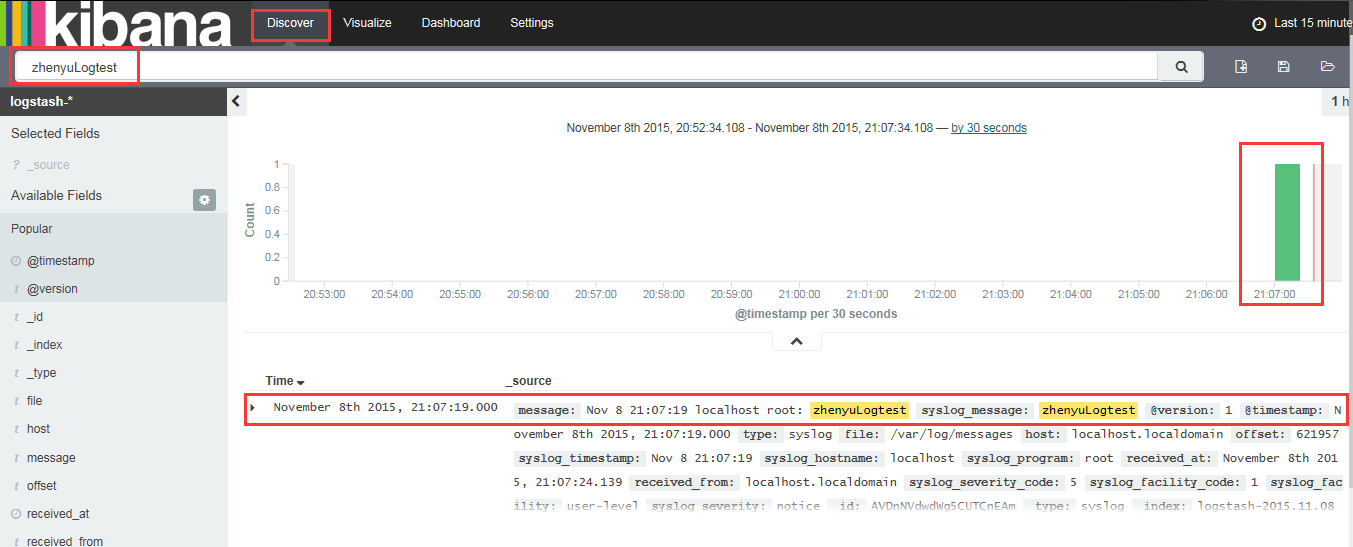
从图中可以看到,手动添加的日志已经在界面中被搜索到了。
本文主要参考了国外一个搭建ELK的视频,操作的很详细,附上视频的下载链接,仅供参考。
链接:http://pan.baidu.com/s/1jGuBWCQ 密码:h0pq