So your Java code runs. Perhaps it even runs on a production server. After you pat yourself on the shoulder on a job well done, we’ve got good news and annoying news.
The annoying news is that now, the debugging starts. Debugging and application performance monitoring that is. This means looking beyond the code written and into the internal workings of the JVM. You don’t only need to do this at the debugging stage (using profilers), but also in production (with an APM) to measure performance and detect issues in your code.
The good news? Contrary to what you may have heard, this doesn’t have to be traumatic or expensive. To help equip you for the ongoing process of optimization and the life of debugging ahead of you, we’ve gathered a list of the best tools to monitor the JVM in both development and production environments. And the best part? They all come for a very affordable price: free. No trials, no license purchases – just the tools you need to delve behind the scenes of your code execution.
What are Java Profilers?
A Java Profiler is a tool that monitors Java bytecode constructs and operations at the JVM level. Profilers track all method calls and memory usage, allowing you to dive into the call structure at whatever angle you choose.
Your standard profiler will provide you with a lot of information, the usefulness of which depends mostly on the debugging task at hand. It should detail out all memory usage by the JVM including object creation, method executions, iterative executions (including recursive calls), thread executions, and garbage collection.
The IDE Defaults
Since process monitoring is so important for efficient development and debugging of Java programs, all popular IDE vendors offer their own branded profiler either built-in or as a plugin you can download.
1.Eclipse MAT
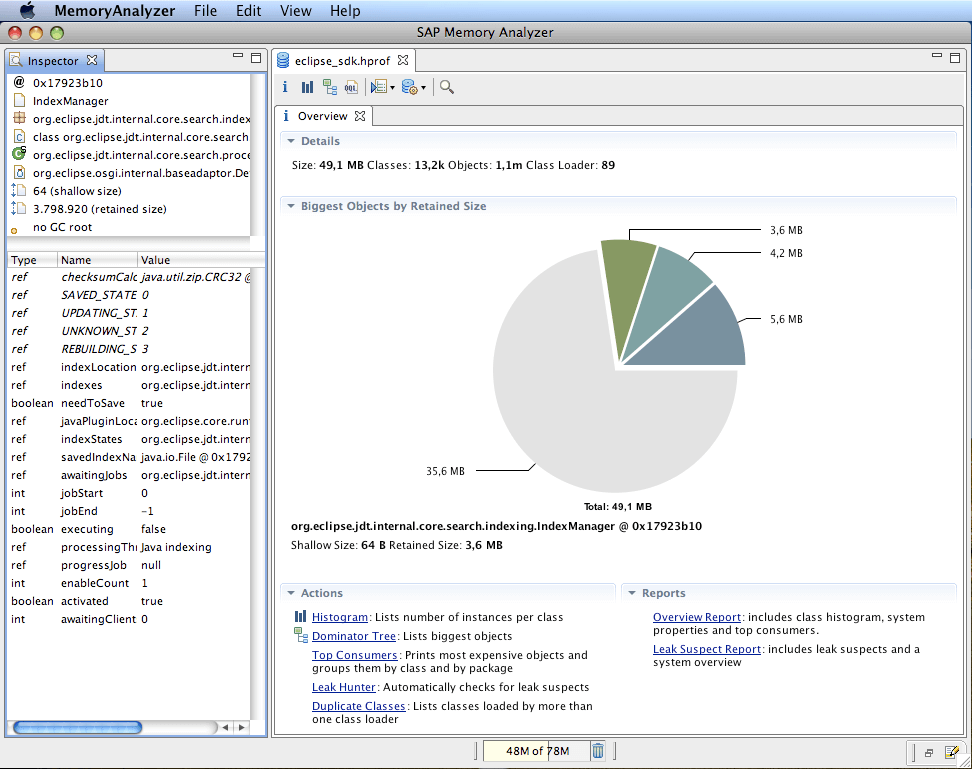
The Eclipse Memory Analyzer is a Java heap analyzer that can help you pinpoint memory leaks and reduce memory consumption. It can be used to analyze productive heap dumps to calculate the retained sizes of objects, see who is preventing the Garbage Collector from collecting objects, and run a report to automatically extract leak suspects.
2.JetBrains JVM Debugger Memory View
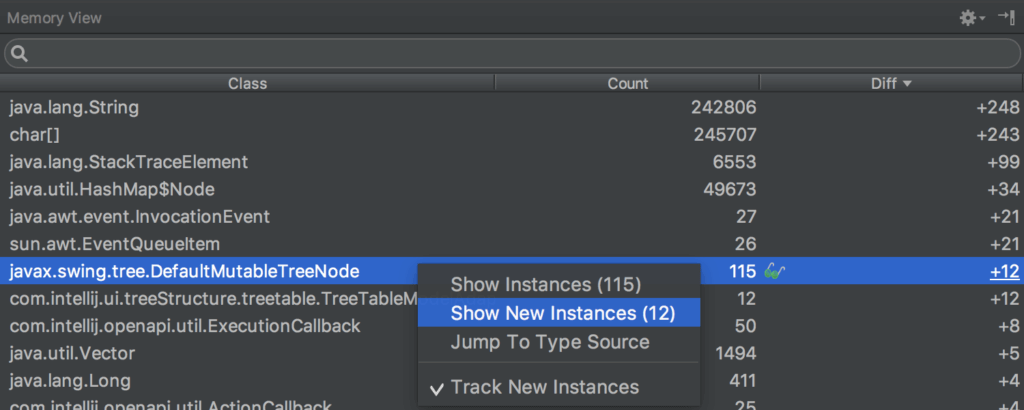
The JVM Debugger Memory View plugin, compatible with both Intellij IDEA and Android Studio, extends the built-in JVM debugger with capabilities to explore objects in the JVM heap during a debug session. It shows you the total number of objects in the heap grouped by their class name.
3.Netbeans Profiler
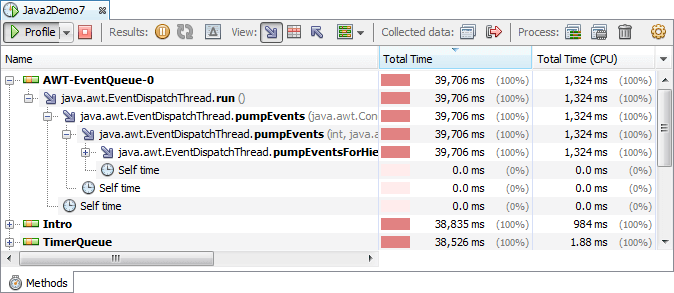
The Netbeans IDE has its own built-in profiler called simply (and rather unoriginally) Profiler. Its features include CPU, memory, threads, locks and SQL queries profiling, as well as basic JVM monitoring.
Alternative Java Process Monitoring Tools
As a programmer, you know that the default is not always the best choice. In fact, it usually isn’t. So it makes sense to check the alternatives to the profiler of your IDE to see which tool is the best for your needs, especially if it’s free.
4.VisualVM
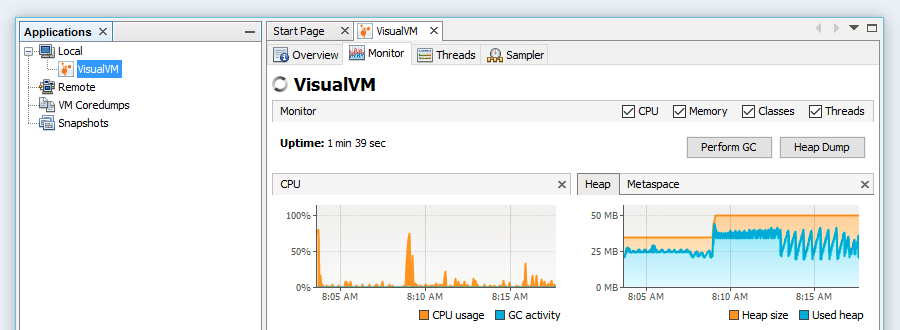
Dubbing itself as an “All-in-One Java Troubleshooting Tool”, VisualVM is a visual tool integrating command-line JDK tools and lightweight profiling capabilities. It monitors and troubleshoots applications running on Java using various technologies including jvmstat, JMX, Serviceability Agent (SA) and Attach API.
5.Oracle Java Mission Control

Java Mission Control, along with Java Flight Recorder, allow for profiling and event collecting of low level information about the behavior of the Java Virtual Machine (JVM) and the Java application. This set of tools, packaged with the Oracle JDK, also provide detailed analysis of the data collected.
Java Application Performance Monitors (APMs)
Application performance monitors are very rarely free. In fact, the majority of AMPs used range from fairly affordable to enterprise-exclusive. Which is really a shame when you consider how important it is to monitor application performance, especially with a complex application topology executing (hopefully) in cohesion on the same server.
Not only because this is a sure way to spot bugs and issues but also because users expect and demand performance from the apps you build. And you should too.
6.Glowroot
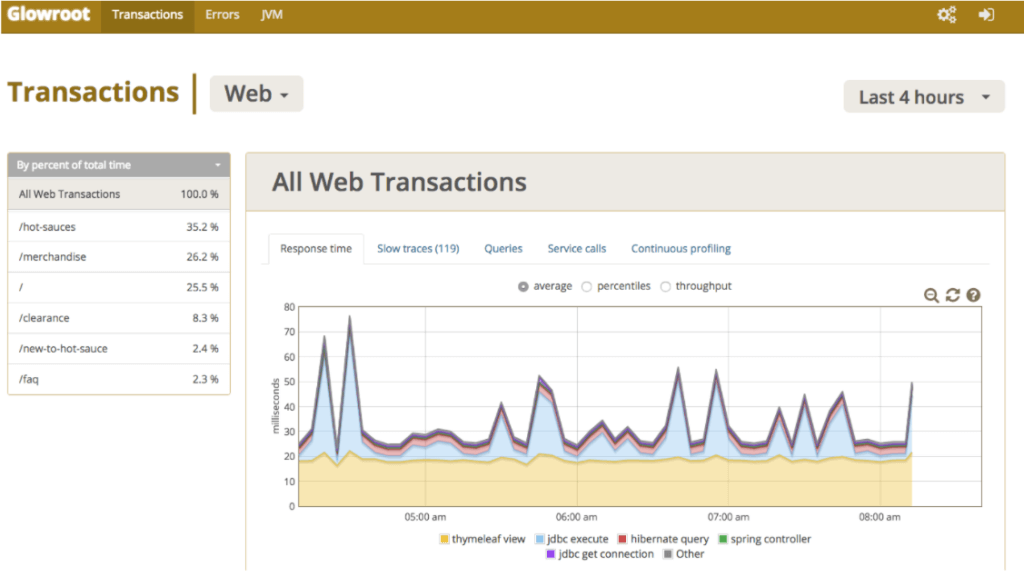
An open source Java APM, Glowroot prides itself on being lightweight, easy to install and offers an extensive feature-set as well as support of a variety of application servers. Free and well-documented, Glowroot is the performance monitoring solution for Java programmers who are also avid fans of open source softwares (or simply lack a budget).
7.Pinpoint
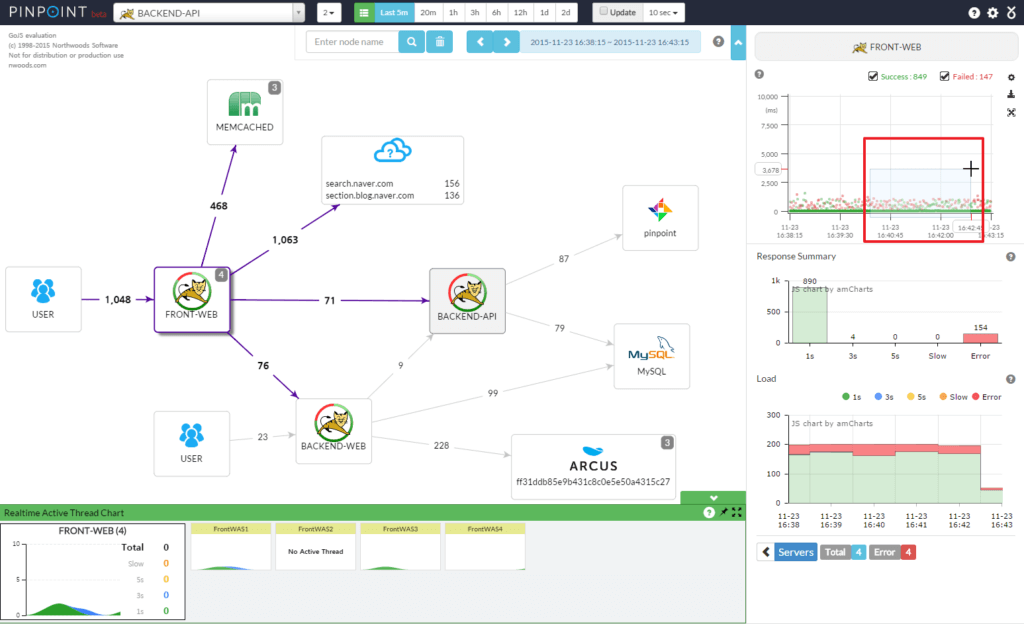
When you go big, pinpointing issues doesn’t get easier, but often harder. Which is why PinPoint can come in handy if you’re looking to monitor the performance of large-scale distributed systems written in Java. Free and open-sourced, PinPoint provides a solution to help analyze the overall structure of the system and how components within them are interconnected by tracing transactions across distributed applications.
8.JavaMelody
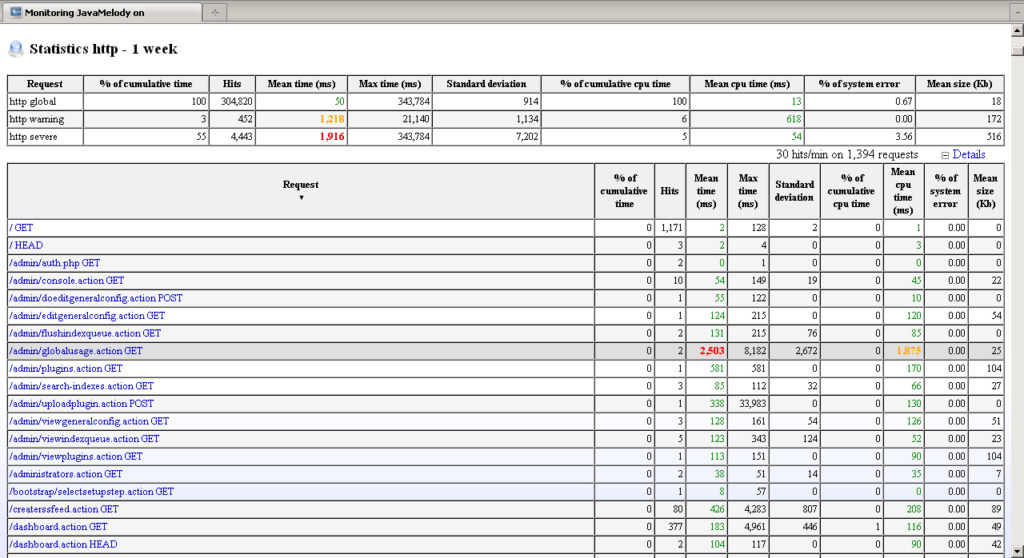
Developed specifically for Java EE applications, JavaMelody lets you measure and calculate the real operation of your applications in QA and production environments. This comprehensive free and open source solution is easy to integrate in most applications and (thanks to its lack of database and profiling) is particularly lightweight.
9.Scouter
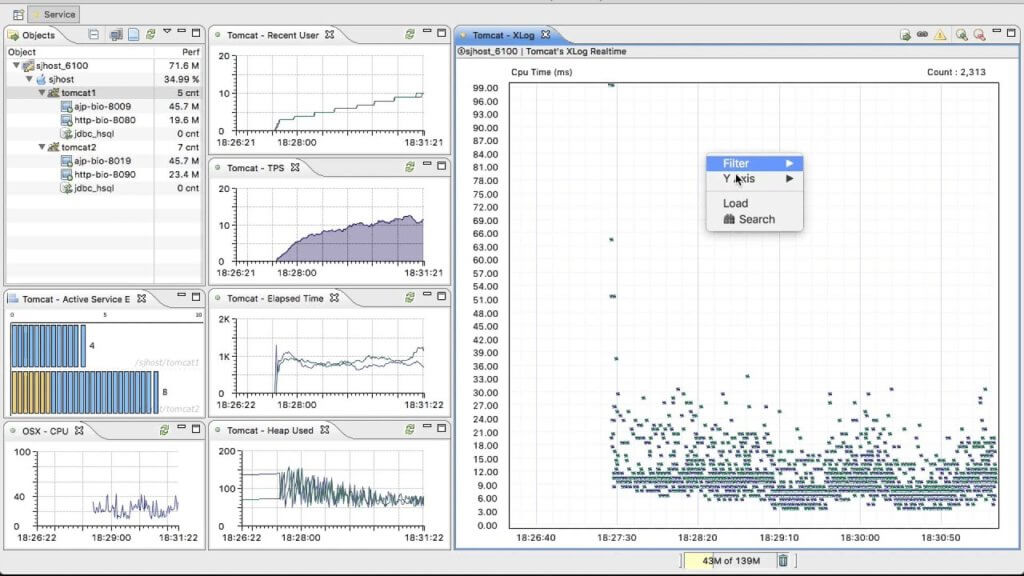
Calling itself “the open source new relic and appdynamics”, Scouter tries to deliver the same value for free and through community development efforts. Among others, scouter can show you information about user activity, service metrics, and resource distribution.
Which is Best?
Having a selection of free solutions to address your problem can be a bit like being a kid in a candy store with unlimited credit. Can’t be good for your dental health. So how to pick one? Well, don’t. You should pick at least two and according to statistics, probably even more.
There’s a good reason all those paid APM services offer a trial period – gotta test before you commit. Either financially or simply by investing the time in picking the tool to integrate. At the end of the day, you deserve a tool to simplify your work making sure your apps run smoothly from code to production. All that, without being tied to a paid service.